For Maths we are doing Geometry and did a “Name the 3D shape” Today in class, here is mine.
Name the 3D shape
- Author By otakicsammyc
- Publication date November 25, 2022
- Categories: Hanga | Create
- Tags: 2022, Maths
- No Comments on Name the 3D shape
For Maths we are doing Geometry and did a “Name the 3D shape” Today in class, here is mine.
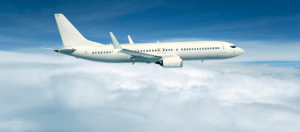
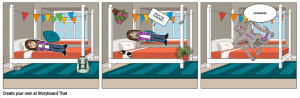
I have made this Story Board of “What if YOU woke up with a Superpower!!”
I hope you enjoy this as I really like it and I could only do 3 of these little boxes, if I could it would be longer.
Sorry if this is fuzzy. The first one says “HELP!! I’M FLOATING!!” and the second one says “Roarrrrr.”
In maths we have been doing investigations. The first investigation we did was “How much water is in a carrot?” It was very fun. After we did this one which you can see my group and I’s work on the investigation. Next we are doing a paper plane investigation which will be very fun.
For the Smarties we wanted to work out how much of each colour was in a Smarties pack.
Problem:
We wonder what colour happens the most in a smartie pack?
Investigation:
For our plan we will be investigating What colour happens the most in a Smartie Pack.
Plan:
Data / Chart:
Table of Smartie colours for our group.
| Colour | Tally | Frequency |
| Orange | || | 2 |
| Yellow | | | 1 |
| Green | ||| | 3 |
| Blue | ||| | 3 |
| Purple | 0 | 0 |
| Pink | 0 | 0 |
| Brown | || | 2 |
| Red | 0 | 0 |
| Total | 11 |
Our most common colour are blue and green.
I notice that Green and Blue have the same Frequency with a total of 3 each.
I notice that yellow had the smallest amount of smarties with a total of 1.
I notice that Brown and Orange have the same total with 2 smarties each.
Data.
Data for the class.
| Colour | Frequency |
| Purple | 19 |
| Brown | 15 |
| Green | 9 |
| Yellow | 16 |
| Blue | 19 |
| Pink | 18 |
| Orange | 5 |
| Red | 8 |
| Total | 109 |
Our Data Graph:

Conclusion:
In conclusion every one of the smartie packs had a different amount of smarties and smartie colours inside which we would think that they would all have the same amount of smarties.
Also in conclusion the most amount of smarties we had was Green and Blue with 3 each, while the most common colour in the class is blue and purple with 19 each.
For maths we have been working out how much water is in a carrot. We got into groups and made a google presentation. I will be showing my groups presentations below.
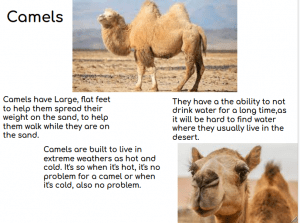
I did this research card on Camels. There are a few interesting facts I wrote about Camels.
I think Camels are really cool as they have special ability maybe even superpowers!
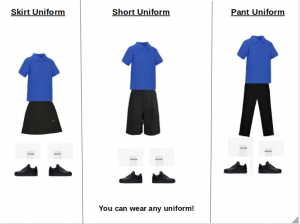
I made some uniforms that if I had a school I would like to have. All of these uniforms are non-binary so you can wear any uniform that you want. These uniforms include a Pants options, Shorts option and a Skirt option.
I tried to make these uniforms as comfy as possible for all of the children.
Here are my uniforms that I made.
This is a Butterflys Life Cycle.

This is my Koru Park.
I have a a Koru cup ride and a Koru burger.
5,570.48 km
New York was going to originally be called New Amsterdam.
New Yorkers speak over 800+ languages.
Honking your car horn is illegal (HONK HONK.)
2,060.6 km
Cape Reinga means under world in Te Reo.
The pohutukawa tree in Cape Reinga is over 800 years old.
Dogs aren’t allowed in Cape Reinga.
16,811 km
France is the most Visited country in the world.
France had a king… That only lasted 20 minutes.
The French eat over 25,000 tons of snails each year.